I admit it -- I'm a chart junkie.
I just love to take rows and columns of business data and turn them into graphs that show exactly which products are doing well and which ones need help.
Actually, I think my fervor is shared by practically every sales and marketing honcho out there. I've never met an executive who didn't prefer to have his or her business trends interpreted visually, rather than trying to make sense of a page full of raw figures.
Turning data into meaningful charts has, until recently, been the province of $100,000 business-intelligence software packages on the high end or -- for those with rock-bottom budgets -- the graphing features of Microsoft Excel. But a much better and much cheaper alternative called Tableau recently emerged, and its more-powerful version 2.0 has just raised the bar even higher.
A Few Others Have Noticed This Product
According to executives at Tableau Software Inc., I was the first journalist to write about the beta version of their 1.0 software product way back on Feb. 22, 2005. Since that time, it's safe to say that other reviewers have discovered for themselves how powerfully Tableau can turn lifeless business data into a gold mine of information:
• PC Magazine named the $999 software "Best of the Year 2005" in the category of Data Analysis.
• DM Review Magazine, a publication specializing in corporate data mining, selected Tableau 1.0 as the winner of its 2005 Data Visualization Competition. The startup's software was chosen as the best charting tool out of more than 40 competing business-intelligence products.
• Intelligent Enterprise Magazine, a business technology periodical, gave the product an Editors' Choice Award in its annual "2006 Companies to Watch" competition. Tableau "embeds best practices to guide users toward productive visualization," the editors said.
The next time you find yourself with, say, a year's worth of sales figures and no idea what lines of business are actually most profitable for your company, consider investing in the new Tableau 2.0, which takes data visualization to a new level.
A Bargain-Priced Product Gains Muscle
I've been using Tableau 1.0 on one of my computers for more than a year. Version 2.0, which went gold a few weeks ago, adds a host of new goodies to your data-visualization palette (in case you felt limited in any way by the old version):
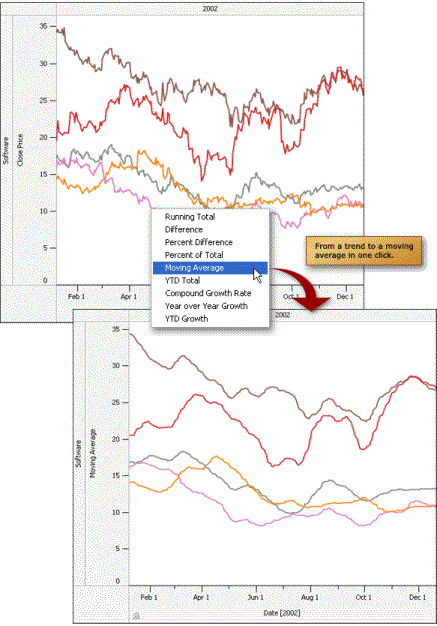
• Calculations on graphed data (not just raw data) are now a simple matter of a couple of clicks. For example, you can turn a chart of daily data into a clearer trend analysis by transforming the date with moving averages, percent change, compound annual growth, and more.
• Animation allows you to "play back" your data. You can watch each month of the past year as if time were rolling by, for example, which can reveal patterns you might never notice from the raw figures alone.
• You can write your own formulae and gain access to the results immediately, instead of waiting for new fields to be populated with this data in your database itself.
• Multiple database tables can be joined into a single view within Tableau 2.0, so there's no need to create a merged database in advance of your analysis.
• Support for SQL databases is a feature of Tableau's MySQL Version (for the open-source MySQL language) and Professional Version (for Microsoft SQL Server, SQL Server Analysis Services, and Oracle, in addition to MySQL). Separate server-based products, at additional cost, enable Tableau 2.0 to analyze data in Hyperion Essbase and IBM DB2 OLAP formats, as well.
A picture is worth a thousand words, so I include in Figure 1, below, an example of one of the new Tableau capabilities. I can't remember how many times I've tinkered around with Excel graphs to turn a series of numbers into a moving average. So it's refreshing to see how quickly Tableau 2.0 can convert a chart full of jagged, noise-filled data into an easily understandable set of moving averages, as shown in the illustration below.
For more information, visit TableauSoftware.com.
Executive Tech is Taking a Four-Week Break
The next installment of Executive Tech will be published on Aug. 29, 2006. I'll be using the free time, not to lie on a beach, but to finish researching the last few chapters of "Windows Vista Secrets." This book, my 11th, will uncover Microsoft's new Vista operating system, which is expected to be available to consumers in January 2007 (or thereabouts). Have a nice summer.

Figure 1: Tableau 2.0 allows you to make data more understandable by directly manipulating the images in a chart display.

